
Data Analytics & Business Intelligence (SQL, Python, Power BI)
Module 1 · Module 1 — Understanding Data · Lesson 1 of 1
Understanding Data
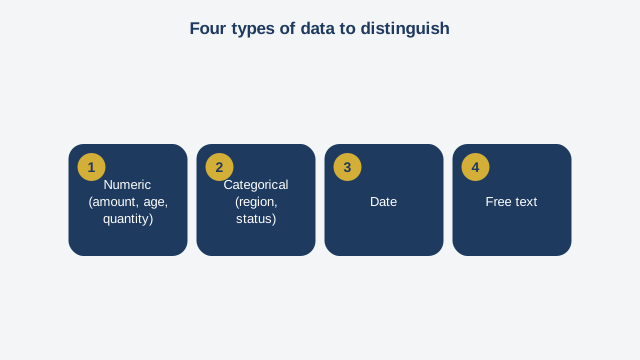
Before opening a single piece of analysis software, you need to grasp a simple but often-ignored truth: an analysis is never better than the data it's built on. There's a well-known phrase for this: "garbage in, garbage out." If the starting data is wrong, incomplete, or misunderstood, no elegant chart and no sophisticated dashboard will fix the problem. Let's start with data types. A piece of data can be numeric — a sales amount, an age, a quantity — or categorical, meaning it represents one category among a limited set of possibilities, like a region or an order status. It can also be a date, or free text. This distinction isn't a technical footnote: it directly determines which operations make sense. You can calculate an average on a numeric amount; that makes no sense on a category like "North" or "South." Next, let's talk about data sources. In a real business, data rarely comes from one clean, centralized place. It often comes from a mix: a point-of-sale software export, a spreadsheet maintained manually by a sales team, a customer management database, sometimes even paper entries digitized after the fact. Each source has its own conventions, its own typical errors, and often its own date or number format. Knowing where a piece of data comes from, before analyzing it, lets you anticipate its likely flaws. Finally, we reach this module's central question: data quality. Four problems show up almost systematically in a real-world dataset. First, missing values — an empty cell where information was expected. Second, duplicates — the same transaction or the same customer recorded twice, often with small spelling variations that block simple automatic detection. Third, format inconsistencies — a date written sometimes day-month-year, sometimes year-month-day, within the same file. Fourth, outliers — a sales amount of ten million CFA francs in a dataset where the average transaction is around twenty thousand francs, which could be a genuine exceptional sale or an obvious data-entry error. The most important skill in this module isn't a tool, it's a habit: before any analysis, systematically run a quick data-quality audit. Count missing values per column, look for obvious duplicates, check format consistency, and flag extreme values that deserve verification. This audit rarely takes more than thirty minutes on a medium-sized dataset, and it saves hours that would otherwise be wasted analyzing data that needed cleaning first.
Free preview, no account needed — the rest of this module and the following modules unlock after enrolling.
Convinced? Enroll to unlock the full course.
See pricing